A Digital Experience Platform (DXP) based on the Symfony framework
Ibexa DXP enables developers to design and develop websites, web applications and complex eCommerce stores. Built on the standard Symfony PHP framework, developers can leverage existing knowledge and integrating custom functionality alongside core features.
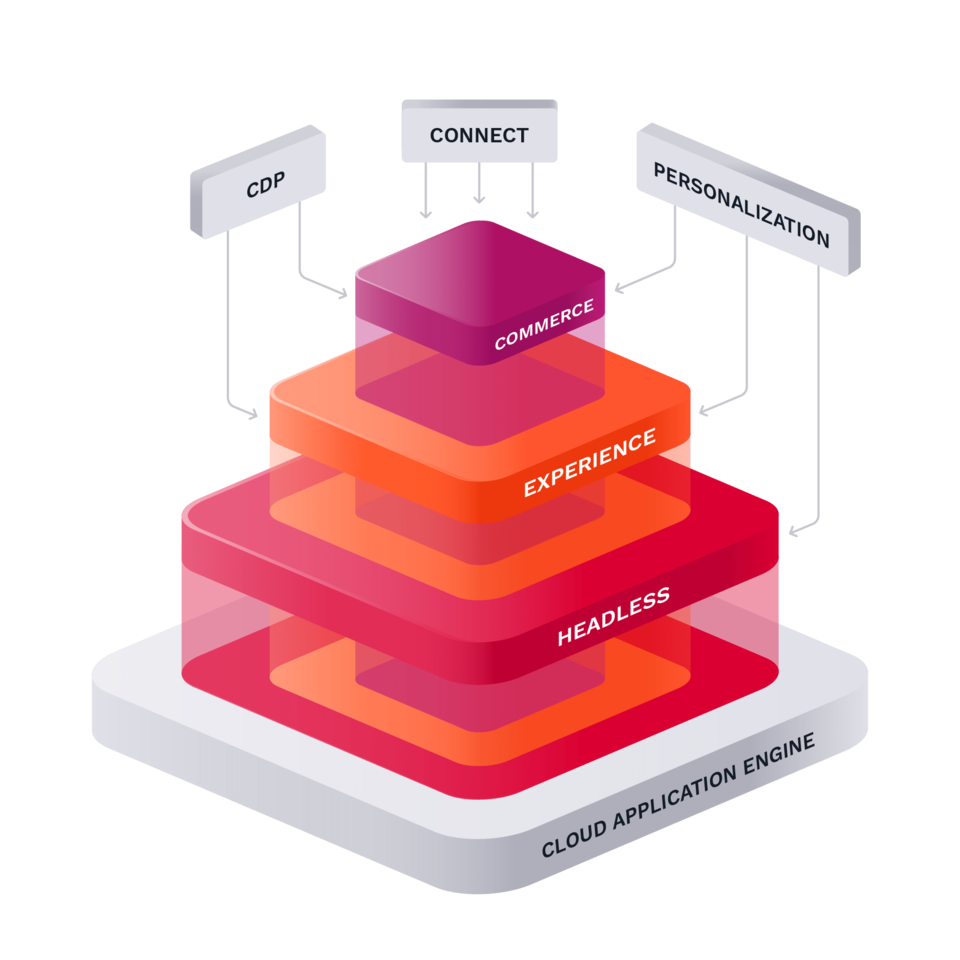

Built on standards, based on open source
At the core of Ibexa DXP is extensibility and connectivity. We provide a comprehensive suite of APIs (GraphQL, REST and PHP) and our products are built on modern Open Source technologies.
Our core technology, Ibexa Open Source is available under the GPL.


A global community
Ibexa has a partner network with companies from around the world. The partners and individuals who work with our software have formed a vibrant community where we share knowledge and experience.
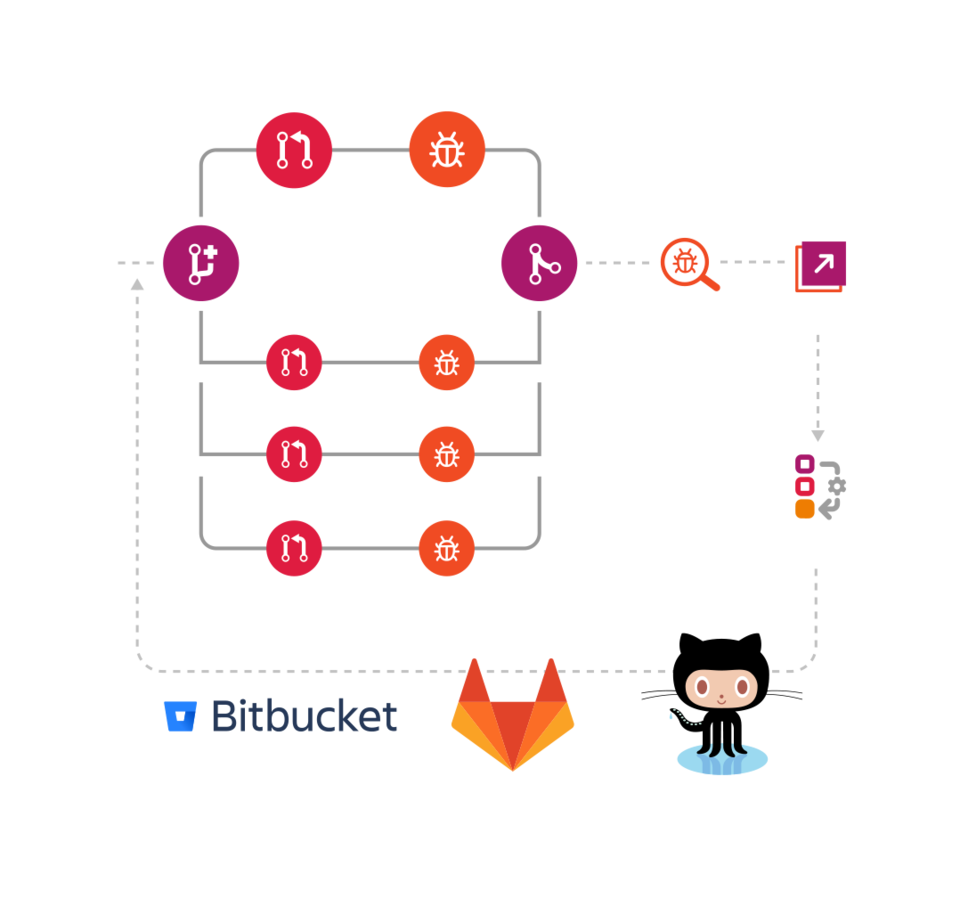
Ibexa DXP is extensible
The architecture of Ibexa DXP allows extending and modifying core functionality. In addition to commercially supported extensions to third-party tools, our community has created free packages for Ibexa DXP as extensions for authentication, new field types and more.
We take security seriously
Ibexa software is widely deployed in business critical roles. Information security is a top priority for businesses of all sizes and clients and partners place their trust in us. We do not compromise on security.
We have a strong track record for building secure software for over two decades. Any found vulnerabilities issues are swiftly addressed and we provide full disclosure through our public security advisories.


What is a Digital Experience Platform (DXP) and how does it differ from a Content Management System (CMS)?
"Designed to provide better customer experiences, Digital Experience Platforms (DXPs) are the natural evolution of your good old (or not so old) CMS, simply with much more functionality and seamless integrations giving you a new perspective in a world that has now fully pivoted to be customer-centric on all fronts."
Where's eZ Platform?
Many of our visitors may be wondering what is Ibexa DXP and where is eZ Platform?
The first iteration of Ibexa DXP was released on October 26th 2020. The Ibexa DXP name essentially replaces the eZ Platform name. Going forward our products will be known by a different name, but this does not mean or change any commitments we have regarding product support.
For previous generation (eZ Platform) and legacy (eZ Publish) product documentation, please refer to: eZ Platform 2.5, eZ Publish 5.x, eZ Publish 4.